
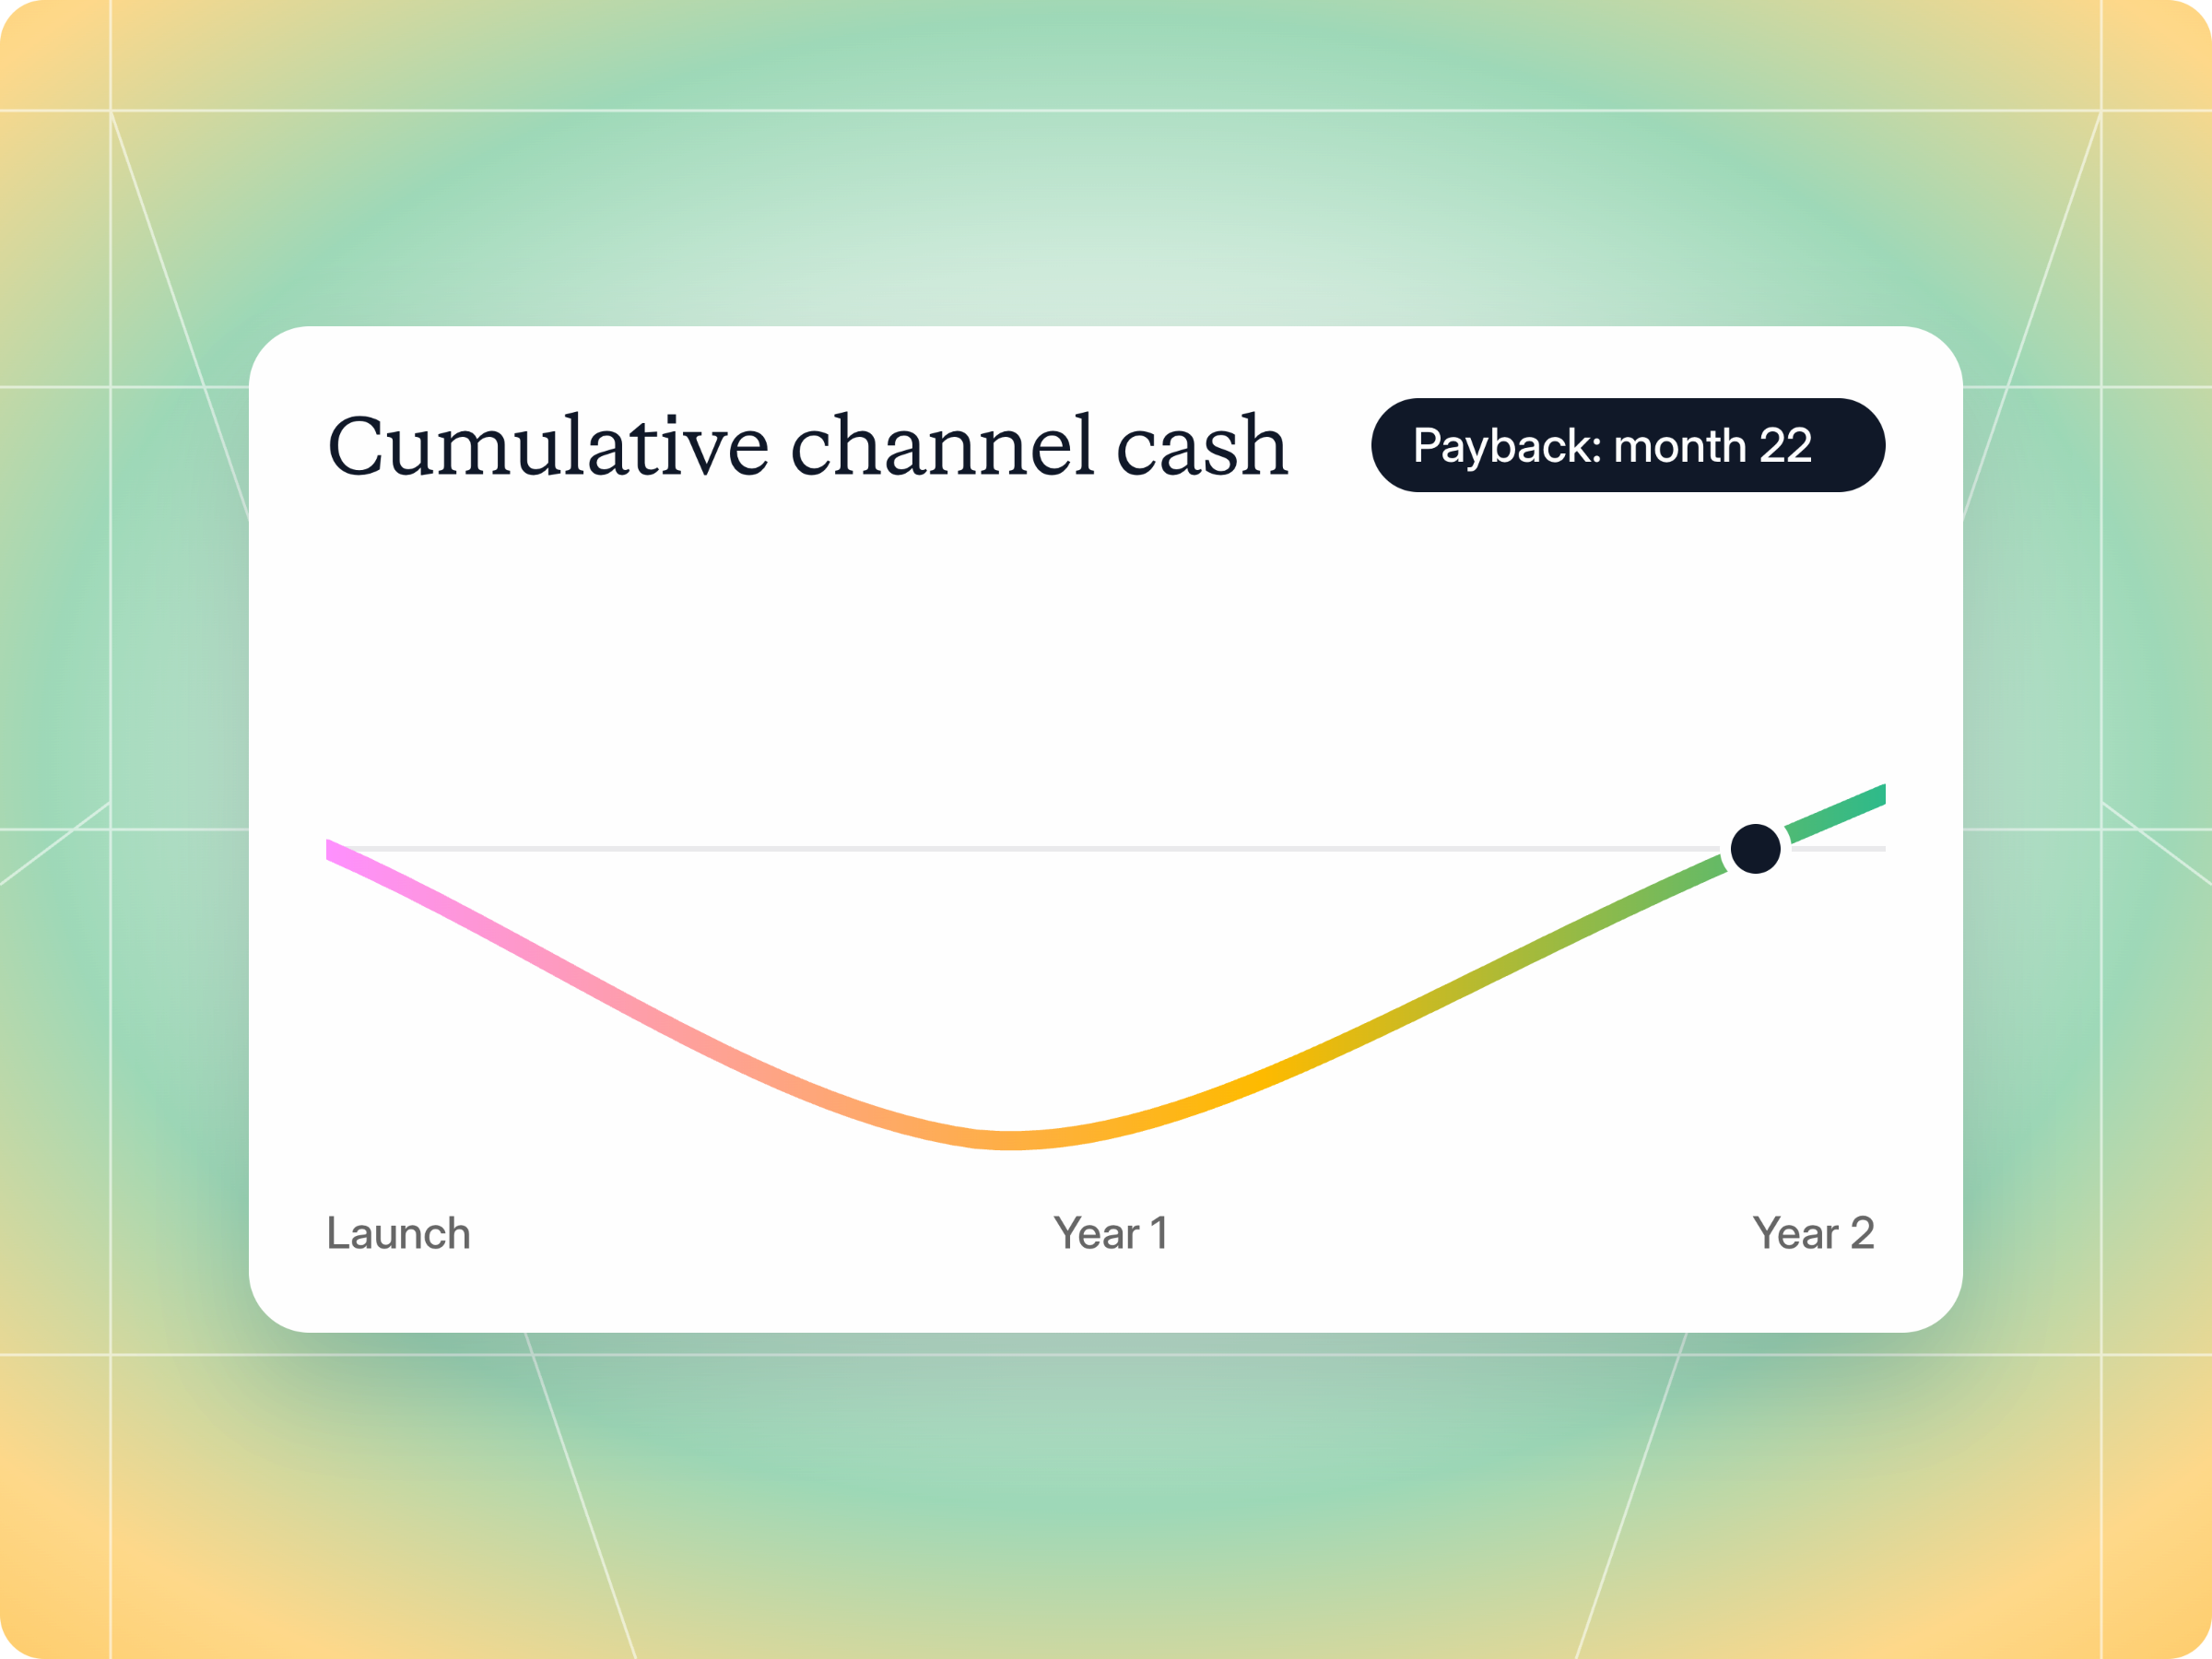
Partner economics is the math behind whether your channel makes or loses money, relationship by relationship and month by month. Most teams know their sourced revenue. Far fewer know their fully loaded channel cost, their partner CAC, or the month the program actually breaks even. This guide breaks down every cost line a channel carries, shows how to calculate partner CAC, payback, and LTV:CAC for the channel, walks through a two year worked model where payback lands in month 22, and explains how to segment by profitability so your budget goes where the margin is.
Partners now sit in the middle of how software gets bought. Canalys forecast that 70% of customer spending on technology, IT services and telecom services would go through partners in 2025. That's most of the market moving through someone else's relationships.

So your CEO approves a new channel. You hire a channel manager, buy a PRM, fund a few co marketing campaigns, and sign 40 partners. Twelve months later, the board deck shows $600,000 in partner sourced ARR. Great, right? Then your CFO asks a simple question: "What did that cost us, and when do we get it back?" And the room goes quiet.
Sound familiar? That's not a partnerships problem. It's a unit economics problem.
This guide covers the full cost of a partner channel, how to calculate partner CAC and payback period, how sourced and influenced revenue change the math, why ramp time is the variable that matters most, and how to spot the relationships that quietly lose you money. It's written for heads of partnerships, RevOps, and finance leaders who need one shared model.
What is partner economics?
Partner economics is the study of how money flows through a partner program: what you spend to recruit, enable, and pay partners, what revenue and margin they bring back, and how long it takes for the second to exceed the first. You'll also hear it called partnership economics or channel economics. The idea is the same. For most organizations, it's the foundation of every strategic decision about the channel: which partners to invest in, which to cut, and where your team should focus, all tied back to business outcomes.
It answers three questions at three levels:
- Program level: Does the channel as a whole pay back, and when?
- Cohort level: Do the partners you recruited this year perform better or worse than last year's?
- Partner level: Which individual partners create profit, and which ones consume more resources than they return?
Unit economics vs program ROI
If you've already calculated partner program ROI, you might wonder why you need another model. ROI tells you whether the channel returned more than it cost over a period. Our guide on how to measure partner program ROI covers that formula, the cost checklist, and a cohort example in detail.
Unit economics answers a different question: what does one partner sourced customer cost, what is that customer worth, and how long until the program's cumulative cash turns positive? ROI is the scorecard. Unit economics is the engine underneath it. You need both, but they're not the same conversation with finance.
Maximizing value for partners: profitability works both ways
There's a second side to partner economics that vendors often forget. Your partners run businesses too, and they decide where to invest based on what they earn with you.
AWS is a useful example. Its Partner Profitability Framework cites a Canalys study finding that partners with a broad set of offerings can earn a $6.40 multiplier for every $1 of AWS sold. The same framework notes that straight resale may yield single digit margins, while managed services generate 30% to 40% gross profit margins through recurring revenue.
Partners act as trusted advisors to their clients. For many of them, the real business is the services around your product: advisory, implementation, configuration, adoption support, and ongoing operations. A resale transaction is just one point in that relationship. The same logic applies whether you're AWS, Microsoft, or a Series B software company with 30 partners.
The lesson for a SaaS vendor? Partners prioritize vendors that create new revenue streams for them across the customer lifecycle, like advisory, implementation, and managed services work, not just a transaction margin. If partner profitability on your product is thin, your partner economics will be thin too, because nobody sells what doesn't pay. Maximizing value for partners is part of maximizing value for you.
The full cost of a partner channel
Here's where most models go wrong. Teams count commissions and forget everything else, so the channel looks cheaper than it is. A fully loaded view includes every dollar the program consumes, whether it shows up in the partnerships budget or not.
| Cost line | What it includes | Often missed |
|---|---|---|
| People | Partner managers, partner marketing, partner ops, a share of RevOps, solutions engineering, and professional services time | Sales engineers who support partner deals, leadership time |
| Tools | PRM software, CRM seats, integrations, third party payout and tax tooling | Spreadsheets and manual work that a tool would replace |
| Commissions and discounts | Referral fees, revenue share, reseller discounts, SPIFFs | Discounts given away on deals the partner didn't influence |
| MDF and co marketing | Market development funds, events, joint campaigns | Unclaimed or unmeasured MDF |
| Enablement | Training, certification, sales content, demo environments | Content refreshes after every product launch |
| Onboarding time | Hours spent getting each partner from signed to first deal | The opportunity cost of partners who never activate |
| Recruitment | Events, outreach, partner directory listings, legal review | Contract negotiation, procurement reviews, and agreement admin |
A few notes on the lines teams usually get wrong.

People are the biggest cost
In the early stages of most programs, people costs dwarf everything else. A partner manager's fully loaded salary, plus slices of partner marketing and ops time, easily outweighs your PRM and MDF budget combined. Allocate shared roles honestly. If a solutions engineer spends a third of their week on partner deals, a third of their cost belongs to the channel.
Commissions and discounts depend on the model
A referral partner earning 20% of first year contract value costs you very differently from a reseller buying at a 30% discount on every renewal. The payout model shapes your margin for years, so choose it deliberately. Our breakdown of revenue share vs commission vs profit share explains how each model affects what you pay and how often. For the mechanics of designing tiers and rates, see our glossary entry on commission structure.
MDF, incentives, and enablement need owners
MDF and incentive spend are easy to approve and hard to measure. Every dollar should map to a funded activity and the leads it produced, or it belongs in the "unknown return" column. A clear channel incentive program ties each incentive to a behavior you want, such as a first registered deal or a certification, so the spend has measurable outcomes attached. Our guide to channel partner incentive programs goes deeper on design.
Onboarding time is a real cost
Every new signing takes hours of onboarding: kickoff calls, training, portal setup, and the first co selling deal. Multiply that by 40 partners and it's a meaningful chunk of a partner manager's year. Anyone who never activates still consumed that time, which is why partner onboarding efficiency shows up directly in your unit economics.
Partner CAC: how to calculate it
Partner customer acquisition cost is your total channel cost for a period divided by the number of new customers the channel produced in that period.
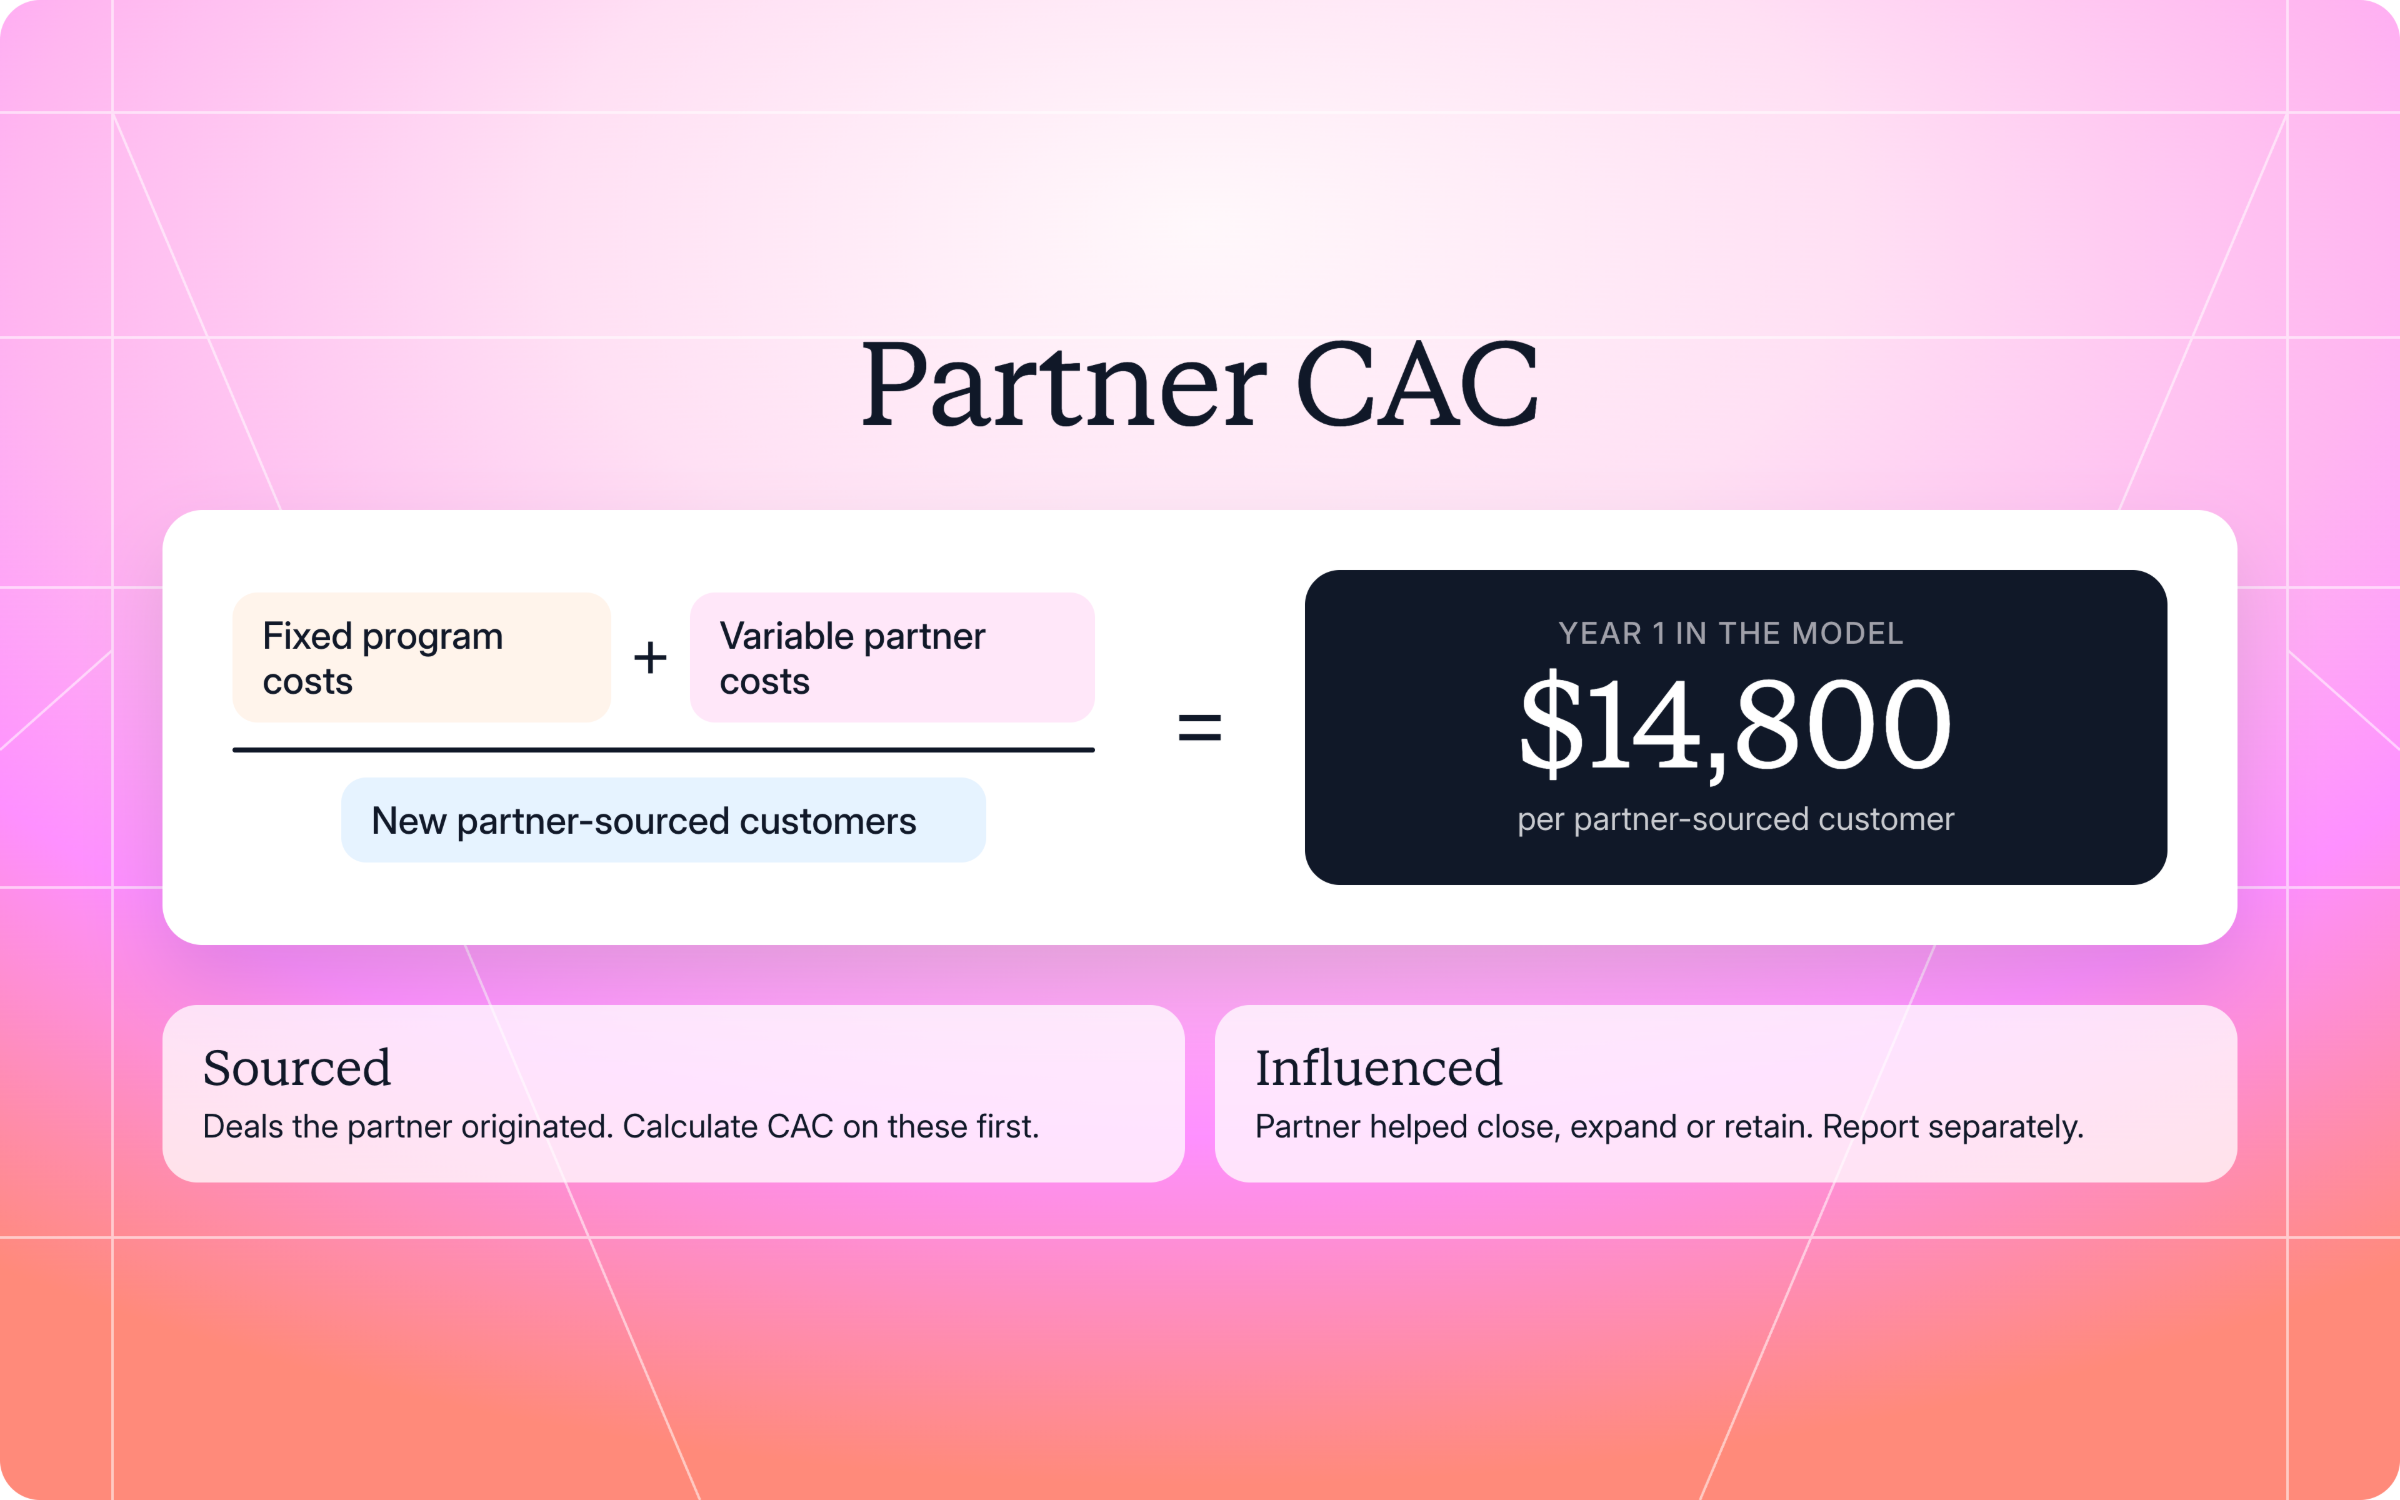
Partner CAC = (fixed program costs + variable partner costs) / new partner sourced customers
Fixed costs are people, tools, enablement, recruitment, and MDF. Variable costs are commissions, reseller margin, and SPIFFs paid on those deals.
Two rules keep this number honest:
- Use the same period for both sides: Don't divide a full year of costs by six months of customers, or the other way around.
- Decide what counts as partner sourced before you start: Change the definition mid year, and CAC moves for reasons that have nothing to do with performance.
Sourced vs influenced revenue changes the math
This is the line every CFO will push on, and one of the biggest challenges in partner economics. Partner sourced revenue comes from deals the partner originated. Partner influenced revenue comes from deals your team originated, where a partner helped close, expand, or retain the customer.
If you count only sourced deals, your CAC looks high and you undervalue partners who help close deals your reps found. If you count influenced deals at full value, you double count revenue that your direct sales team also claims. Neither is right on its own.
A practical approach:
- Calculate CAC on sourced deals first: It's the cleanest, most defensible number.
- Report influenced revenue separately: Show win rate and deal cycle on influenced deals vs deals with no partner involved.
- Agree on a credit rule with finance: For example, sourced deals count at 100% and influenced deals at a fixed share, applied consistently.
Our guide to partner attribution walks through attribution models in detail, and the partner revenue attribution glossary entry covers the definitions. Whichever model you adopt, attribution has to live on the CRM deal, not in a spreadsheet, or your unit economics will never reconcile with the revenue line.
Here's how to link CRM deals to the partners who sourced or influenced them in Introw, so reporting and commissions pick up the right partner:
Payback period and LTV:CAC for the channel
Once you have partner CAC, two metrics tell you whether the channel is worth scaling.
Customer payback vs program payback
Customer payback is how many months of gross profit it takes to recover the CAC of one partner sourced customer. If partner CAC is $14,800 and each customer brings $1,600 a month in gross profit, payback is about 9 months.
Program payback is the month when the channel's cumulative gross profit exceeds its cumulative costs. This number is always later than customer payback, because you pay for people and tools from day one while partners take months to ramp.
Finance cares about both. Customer payback tells you whether each deal is efficient. Program payback tells you how much cash the channel needs before it funds itself.
Why does this matter so much? In Kyle Poyar and High Alpha's 2025 SaaS Benchmarks Report, which surveyed more than 800 companies, CAC payback period and net revenue retention were named the two strongest predictors of long term, profitable growth. Your partner channel should be held to the same standard as every other acquisition channel.
LTV:CAC for the channel
Lifetime value for a partner sourced customer is the gross profit you expect over its life. A simple, conservative version caps the life at five years:
Partner LTV = annual contract value x gross margin x sum of expected retention over five years
Then divide by partner CAC. A ratio of 3:1 is a common rule of thumb in SaaS, but treat it as a starting point, not a benchmark. Partner sourced customers often retain better because partners who deliver implementation services bring real expertise and stay involved after go live, which pushes LTV up. Model it with your own retention data, split by sourced and direct, before you claim it.
Ramp time: the variable that decides payback
If you remember one thing from this guide, make it this: time to first deal drives channel payback more than commission rates do.
Every month between signing and a first closed deal is a month you're paying for onboarding and support with nothing coming back. Track two numbers:
- Time to first deal: Days from contract signature to first closed won deal, per partner and per cohort.
- Activation rate: The share of signed partners who have closed at least one deal. Our glossary entry on partner activation rate covers how to measure it.
Payback optimization usually comes down to onboarding: a clear first 30 days, a short certification, a ready to use co selling motion, and deal registration through a simple form that partners actually use. If you're evaluating tools for this stage, our roundup of partner onboarding software covers what to look for.
A worked example: two years of partner program unit economics
Let's put it together. If you're developing your first model, start here. This is an illustrative model for a B2B SaaS business launching a referral led partner program. The numbers are made up but realistic, so you can swap in your own.
Assumptions:
- Deal size: $24,000 ACV ($2,000 a month), 80% gross margin.
- Commission: 20% of first year contract value, paid at close ($4,800 per deal), nothing on renewals.
- Ramp: No partner sourced deals in months 1 to 3. The first deal lands in month 4, and volume builds to five deals in month 12.
- Year 2: Three to four new deals a month, 40 for the year.
- Retention: 90% of customers renew at their first anniversary.
- Revenue timing: Each customer starts billing the month after close.
| Year 1 | Year 2 | |
|---|---|---|
| People (partner manager, share of partner ops) | $180,000 | $180,000 |
| Tools (PRM, integrations) | $15,000 | $15,000 |
| Enablement and onboarding | $20,000 | $10,000 |
| MDF and co marketing | $25,000 | $20,000 |
| Recruitment and events | $10,000 | $5,000 |
| Fixed program cost | $250,000 | $230,000 |
| New partner sourced customers | 25 | 40 |
| New ARR booked | $600,000 | $960,000 |
| Commissions paid | $120,000 | $192,000 |
| Recognized revenue | $140,000 | $994,000 |
| Gross profit (80% margin) | $112,000 | $795,200 |
| Net channel contribution | ($258,000) | $373,200 |
| Cumulative contribution | ($258,000) | $115,200 |
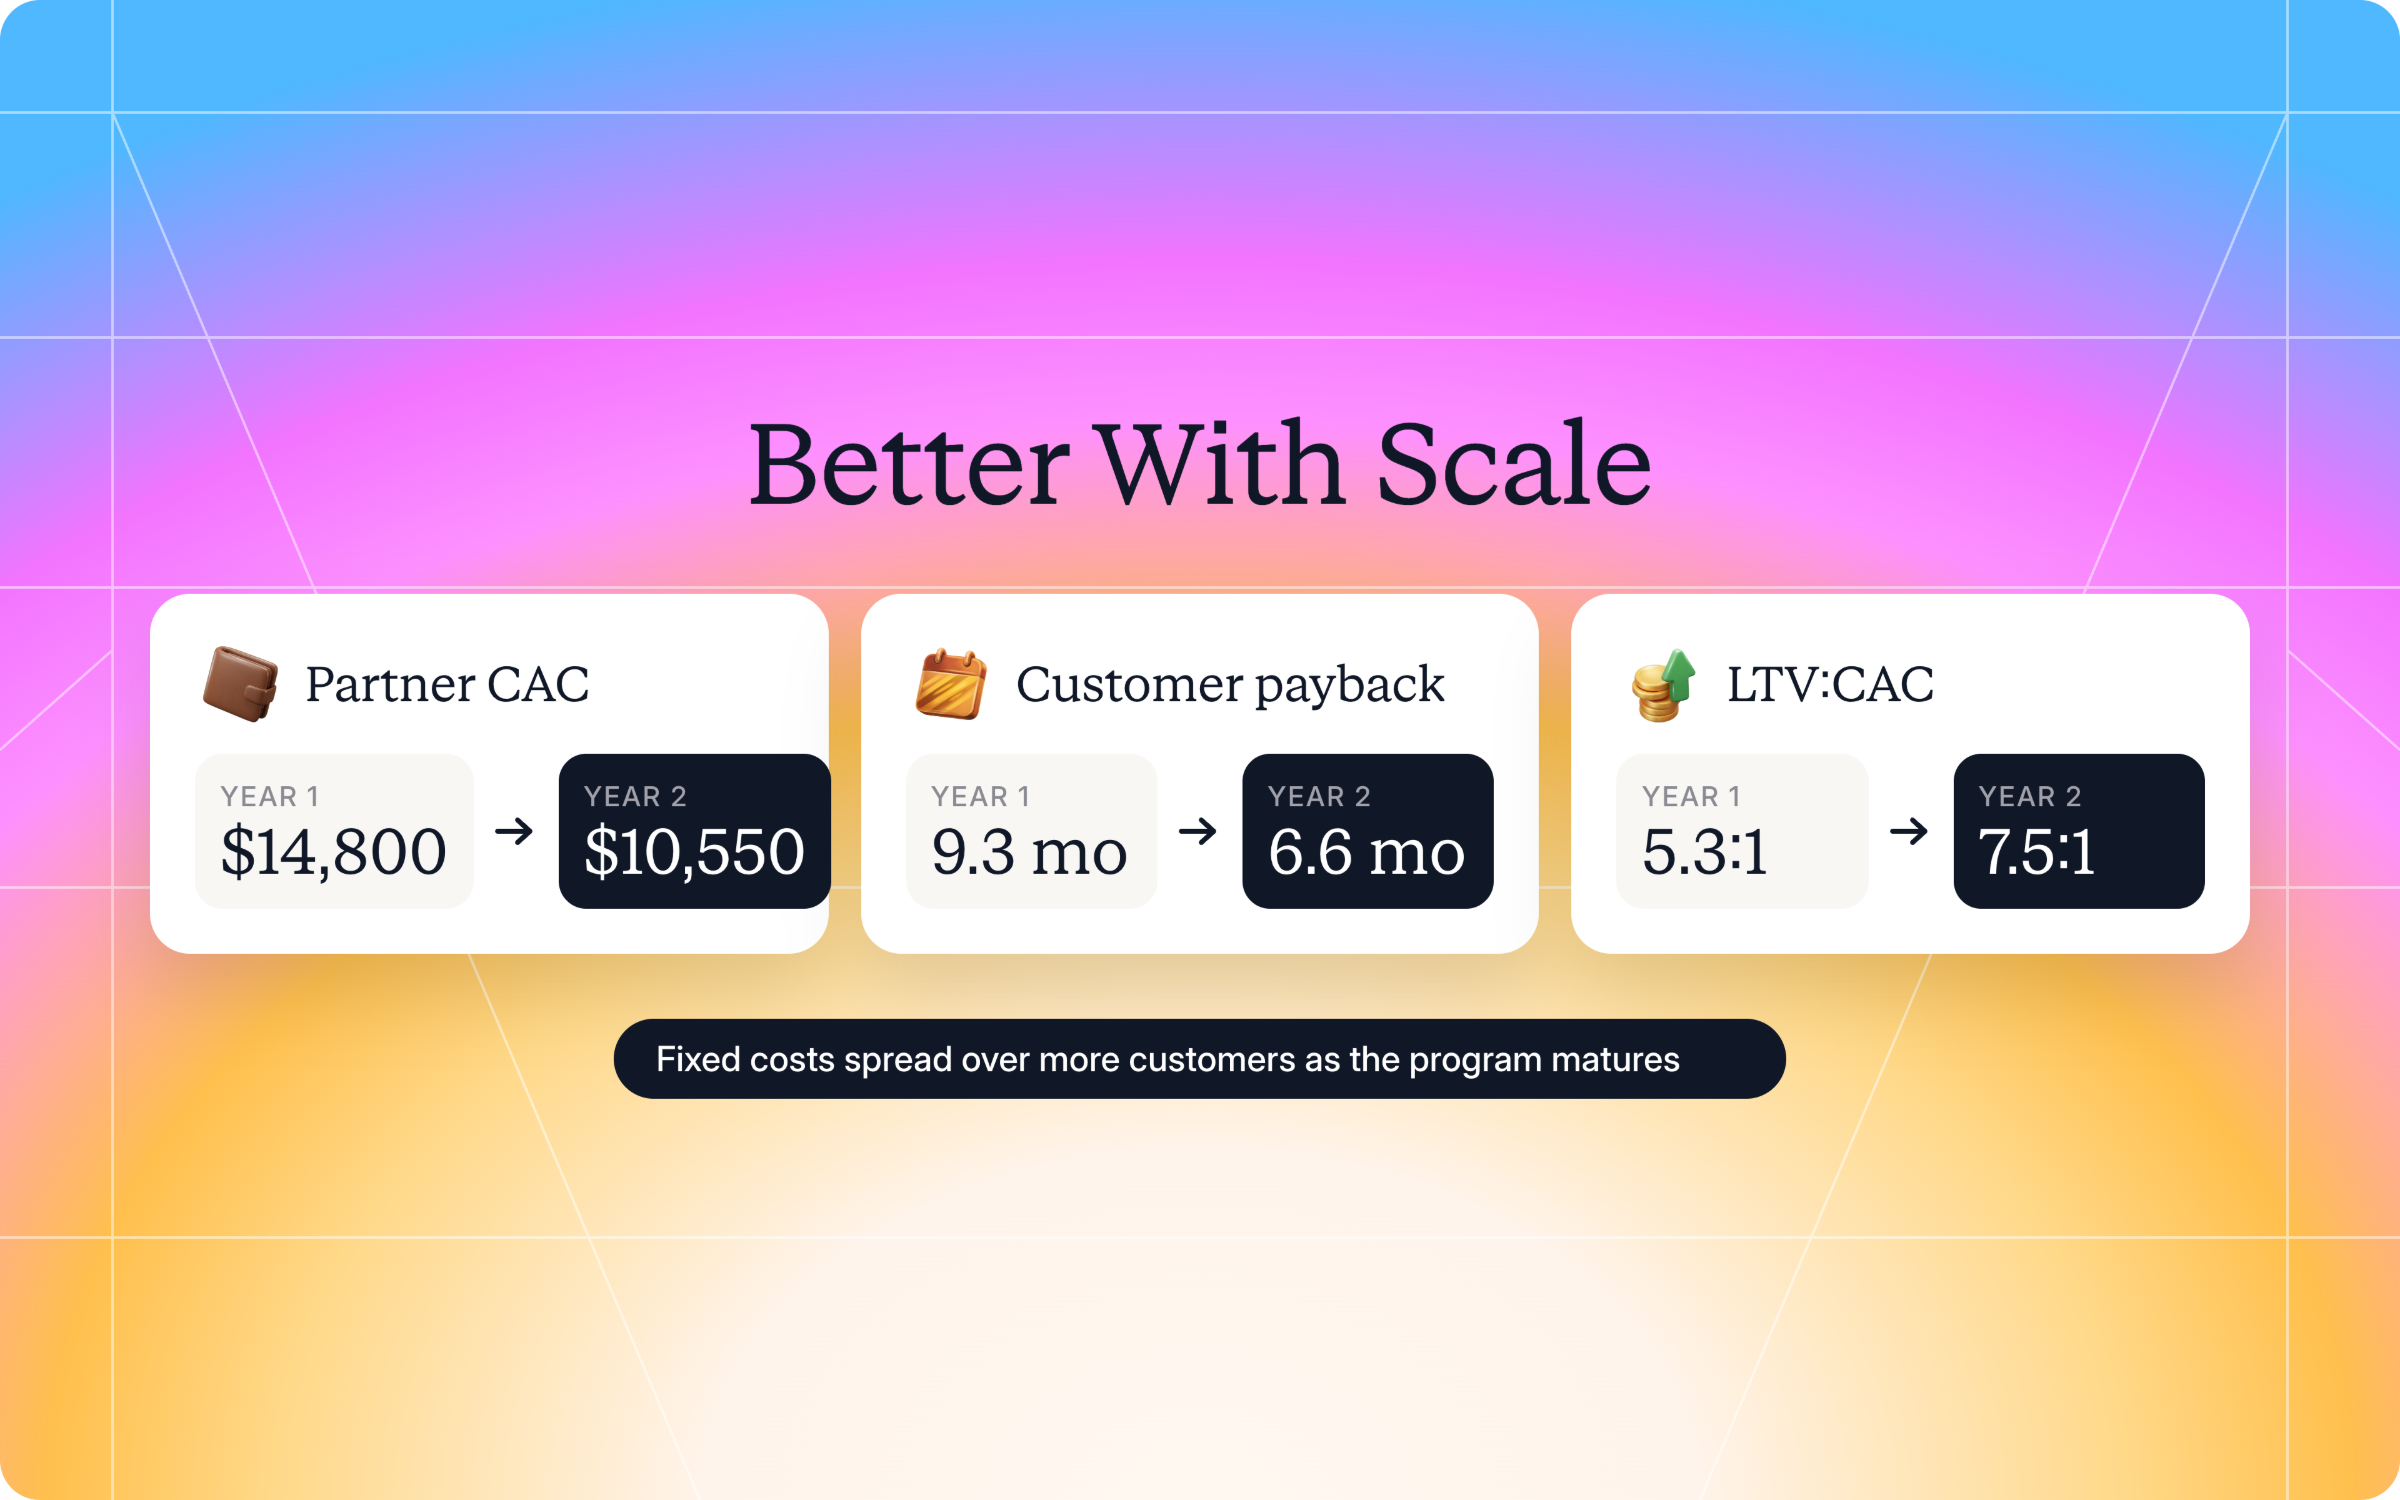
| Partner CAC | $14,800 | $10,550 |
| Customer payback | 9.3 months | 6.6 months |
What the model tells you

- Year 1 looks terrible, and that's normal: The program booked $600,000 in ARR but recognized only $140,000 in revenue, because deals arrived late in the year. Costs, meanwhile, ran from month one.
- Program payback lands in month 22: That's when cumulative gross profit finally covers every dollar spent since launch. By the end of year 2, the channel is $115,200 ahead.
- Partner CAC drops by almost 30%: Fixed costs spread over more customers, and onboarding costs fall as the program matures.
- LTV:CAC improves with scale: With a five year LTV of roughly $78,600 per customer (based on 90% annual retention), LTV:CAC goes from about 5.3:1 in year 1 to 7.5:1 in year 2.
Sensitivity: what moves payback
The model is only as useful as your understanding of what breaks it. Here's how program payback shifts when one assumption changes and everything else stays the same:
| Scenario | Program payback |
|---|---|
| Base case | Month 22 |
| Ramp three months slower (first deal in month 7) | Month 27 |
| Commission at 30% instead of 20% | Month 25 |
| Smaller deals ($18,000 ACV) | Month 25 |
| Fixed costs $100,000 higher per year | Month 26 |
Notice that a three month slower ramp hurts more than a 50% higher commission rate. That's why the best partner leaders obsess over activation before they negotiate rates.

Importantly, this model counts only sourced revenue. It ignores influenced deals, expansion, and the lift partners can give your win rate, so treat it as a conservative floor rather than the full picture.
Benchmarks: what's credible and what isn't
You'll see plenty of industry benchmarks for partner programs on social media. Treat most of them with care. Public, methodologically sound data on partner CAC and channel payback for B2B SaaS is scarce, and the numbers that circulate often come from vendor surveys with small, self selected samples.
What you can rely on:
- Market scale: Analyst firms like Canalys publish channel share of IT spending, which tells you partners matter, not what your channel should cost.
- General SaaS efficiency: Large surveys like the one above confirm payback and retention as the metrics that predict efficient growth outcomes.
- Your own cohorts: The most credible benchmark you have is last year's partner cohort vs this year's, measured with the same definitions.
The key insight? Build your own baseline. Track partner CAC, customer payback, program payback, and time to first deal every quarter, and compare partner sourced customers against direct ones on retention and expansion. After four quarters, you'll have a benchmark nobody can argue with, and a much stronger position in every budget conversation with finance. Our guide to partner analytics covers the wider set of metrics worth tracking alongside these.
Partner profitability: finding the partners who cost more than they return
Program level numbers hide a lot. In most ecosystems, a small group drives most sourced revenue, while other partners consume support, onboarding, and MDF without producing much.
Calculate profit per partner
For each partner, track:
- Revenue contributed: Sourced revenue generated by the partner, plus your agreed share of influenced revenue.
- Direct costs: Commissions, reseller margin, SPIFFs, and MDF paid to or spent on them.
- Allocated costs: A share of partner manager, enablement, and support time, based on how much attention each partner actually gets.
- Partner contribution: Gross profit from their customers minus direct and allocated costs.
You don't need perfect cost allocation. A rough split by tier is enough to see the pattern.
Here's what a single partner's analytics look like in Introw, with revenue, deals, engagement, and goal progress in one view:
Segment your partner ecosystem by profitability
Once you have those numbers, group the channel into four segments and give each a different strategy.
| Segment | What it looks like | What to do |
|---|---|---|
| Profitable and growing | High revenue, healthy margin after costs | Invest more: better terms, joint planning, higher tier benefits |
| Profitable but flat | Steady revenue, little growth | Collaborate on expansion plays, new solution areas, or managed services offerings |
| High cost, low return | Heavy MDF, margin giveaways, or support use with little revenue | They take more value than they deliver, so renegotiate terms, tie MDF to results, or reduce investment |
| Inactive | Signed but no deals after two quarters | Contact them with a reactivation push, then move them to a self serve tier or exit |
The unprofitable segment is the one teams avoid looking at. Often it's a reseller that gets a big margin on deals your team actually sourced, or one that claims MDF every quarter without producing leads. That's also where channel conflict tends to hide. Moving them to performance based terms, or to a lighter tier, can lift program margin without losing meaningful revenue. Partner tiering that updates automatically based on performance makes this much easier to manage at scale.

For the ongoing side of this, our guide to channel partner performance management covers scorecards, QBRs, and how to have the conversation when someone isn't pulling their weight.
How Introw helps you track partner economics
Introw is a CRM first partner relationship management platform, which means it builds on top of your existing HubSpot or Salesforce setup rather than replacing it. That matters for unit economics, because the revenue, the attribution, and the costs all sit on the same data your finance team already trusts. Here are the capabilities that matter most for your model:
- Attribution from your CRM: Introw reads the partner data you already record on deals, whether that's custom properties, association labels, or a custom object in HubSpot, or picklists, lookups, or custom objects in Salesforce. You set it up once under Linked objects.
- Commissions that trace to deals: Commission plans support revenue shares, fixed fees, one time bonuses, and recurring rewards. Commission lines are calculated from CRM or billing records, and your team can review, decline, postpone, or adjust them before payout.
- Payouts finance can reconcile: Each partner gets one payout per period with a statement showing the commission lines behind it. Pay through Introw Pay, or export to your finance stack by CSV or API. Partners see forecasted, upcoming, and paid earnings in the portal, so they don't need to contact your team for status updates.
- MDF with ROI attached: MDF management calculates ROI from CRM leads tagged to each funded project, so marketing spend stops being a blind spot in your cost model.
- Reports across revenue and cost: The report builder combines live CRM deals with engagement, commissions, and MDF data, and partner performance dashboards show revenue, deal count, average deal size, and sales cycle per partner.
- Goals by tier and partner: Set targets by tier, partner, or segment, and see each partner's pace as achieved, on track, behind, or critical.
Here's how to build a custom report in Introw, from picking a data source to saving it for dashboards:
That's what good partner economics looks like: one model your CFO trusts, built on CRM data, that shows exactly when the channel pays back and which partners make it happen. See how Introw connects partner revenue, commissions, and MDF in one place. Book a demo or explore Partner Performance.
Still curious? Here are some quick answers to help clear things up
Partner economics is the financial model behind a partner program. It covers what you spend to recruit, enable, and pay partners, the revenue and margin they bring back, and how long it takes for the program to pay back. It also includes partner profitability, meaning whether each partner earns enough from resale and services around your product to keep investing in it.
Add your fixed program costs (people, tools, enablement, MDF, recruitment) and variable partner costs (commissions, discounts, SPIFFs) for a period, then divide by the number of new partner sourced customers in the same period. Calculate it on sourced deals first and report influenced revenue separately.
It depends on ramp time, deal size, commission rates, and fixed costs. Many programs run at a loss in year 1 because partners take months to close their first deal while costs start on day one. In our illustrative model, program payback lands in month 22. Build your own model with real cohort data rather than relying on a generic benchmark.
Partner sourced revenue comes from deals the partner originated. Partner influenced revenue comes from deals your team originated where a partner helped close, expand, or retain the customer. Count sourced revenue in your core CAC math, and agree on a separate, consistent credit rule for influenced deals with finance.
Calculate profit per partner, then segment partners into profitable and growing, profitable but flat, high cost and low return, and inactive. Invest more in the first group, help the second find new revenue streams, move the third to performance based terms, and reactivate or exit the fourth. Shortening time to first deal improves profitability across every segment.




See AI-Native PRM in Action
Book a demo with one of our partner program experts, or explore Introw on your own time.