

Most partner programs find out a partner went quiet at the QBR, weeks after it happened. The Claude skill that fixes that is Ecosystem Anomaly Detector. It compares every partner's last 7 days against their own trailing 90 day baseline, flags activity drops and spikes, register and stall deals, deal size outliers, goal pace cliffs and cohort level shifts, filters out the noise, and hands you a short, ranked list with a recommended next step for each item. It never acts on its own: you decide what's worth celebrating, fixing or ignoring, and you approve anything it writes. The full SKILL.md is below, free to copy, along with install steps, prompts to try and an example of what you'll get back.
Here's a number most channel teams will recognize. Introw's ecosystem performance playbook cites an industry estimate that ad hoc analytics requests eat 30 to 50% of channel RevOps team capacity. Your RevOps team spends a third of its week answering "what's going on with partner X?", and the answers still arrive days late.
You've probably lived the result. A reseller that registered a deal every week in Q2 goes dark in week 2 of the quarter. Nobody notices. The partner manager is busy with onboarding, RevOps is building the board deck, and the dashboard looks fine because the totals still add up. Then week 12 arrives, the QBR starts, and the first slide shows a partner who stopped selling two and a half months ago.
What if you'd known in week 2?
That's the job of partner performance monitoring, and it's a job a Claude skill does well. This guide covers what partner performance monitoring is and which metrics matter, why quarterly reporting catches problems too late, the Claude skill that scans your partner ecosystem for drops and spikes, the full SKILL.md you can copy, how to install and run it, and how you stay in control of what it flags.
What partner performance monitoring is (and isn't)
Partner performance monitoring is the ongoing practice of watching how each partner, and each group of partners, is performing against what you'd expect, so you can act while there's still time to change the outcome. It sits inside broader partner management and partner performance management, which also cover goal setting, incentive programs, tiering and partner enablement. Monitoring is the part that tells you when something has changed.
It helps to separate three things that often get lumped together:
- Partner performance reporting: a look back. The quarterly deck, the board slide, the QBR summary. It answers "what happened?"
- Partner performance dashboards: a live view of key metrics, often with real time reporting. Useful, but someone has to open them, read them and notice the one partner whose line bent the wrong way.
- Partner performance monitoring: a continuous scan that compares current partner activity against a baseline and tells you what's unusual. It answers "what changed, and does anyone need to act?"
Most programs do the first two well and skip the third. That's why problems show up as quarterly surprises. Introw's guide to channel partner performance management covers the full discipline. This article focuses on the monitoring layer, because it's the piece that turns partner data into early warnings instead of postmortems.
How to measure partner performance: the metrics worth monitoring
You can't monitor everything, and you shouldn't try. The channel partner performance metrics that make good early warning signals are the ones that move before revenue does:
- Partner engagement: portal logins, content downloads, training activity, replies to your campaigns. An engagement score is usually the first metric to drop when a partner relationship cools.
- Deal registration cadence: how often each partner registers deals or shares leads. A partner that registered every week and hasn't in three weeks is telling you something.
- Pipeline metrics: pipeline value, average deal size, stage velocity and conversion rates on partner deals. A deal stuck in stage for twice the usual time is a signal, not a statistic.
- Goal pacing: progress against each partner's committed goals. Your partner goals only help if you notice when someone falls off pace.
- Revenue contribution: leads generated, partner sourced revenue, total revenue generated per partner, and how concentrated new pipeline is across your partner network.
- Commissions: earned versus expected, which works as a quick proxy for whether a partner's own performance is tracking.
- Enablement metrics: training completion rates and certifications. These are partner enablement metrics, and they tend to lead pipeline by a quarter.
Partner satisfaction, partner feedback and customer satisfaction scores matter too, but they move slowly and arrive in surveys. For weekly monitoring, stick to the signals your CRM and partner portal capture automatically. If you want a single view per partner, a partner scorecard is the right container for these partner KPIs.
The point isn't to collect partner metrics for their own sake. It's to spot performance trends early enough to act: give underperforming partners additional training or additional support, share marketing materials with a partner who's ready to generate leads, and identify opportunities where a partner is outpacing their tier. Track partner performance this way and the data turns into valuable insights for revenue growth, instead of a report nobody reads until the quarter is over.
Effective partner monitoring ties metrics to business goals
Effective partner performance management connects these performance metrics to your business goals. If the goal is market reach in a new region, partner activity and pipeline contribution from that region matter more than total revenue. If the goal is revenue growth rate, watch partner revenue, potential deals in the pipeline and the potential revenue sitting at each stage. Either way, the aim is the same: help partners understand what good looks like, reward the desired behaviors, and close performance gaps before they show up in the sales process.
That's also how you measure partner engagement in a way that means something. Logins alone don't tell you much. Engagement that leads to registrations, leads generated and deals moving forward does. Tie the two together and you get partner effectiveness you can act on, and performance improvement you can prove across your channel program.
Why quarterly reviews catch problems too late
The way most teams track partner performance has a timing problem built in. Data aggregation happens once a quarter, someone reads it, and decisions follow. Between cycles, the channel program runs on gut feel.
Here's how that compares with continuous monitoring, and why a data driven channel program needs both:
| Question | Quarterly reporting | Continuous partner performance monitoring |
|---|---|---|
| When you find out a partner went quiet | At the QBR, often 6 to 10 weeks later | Within a week, sometimes days |
| What you compare against | Last quarter's totals | Each partner's own 90 day baseline |
| Who notices | Whoever builds the deck | Everyone who reads the weekly scan |
| Good news | Celebrated after the fact | Spotted while you can still support it |
| Data quality issues | Found during the reporting scramble | Flagged as outliers the week they appear |
| RevOps effort | Days of manual pulls per cycle | A prompt, run on cadence |
The deeper issue is that totals hide individuals. Your channel performance management dashboard can show pipeline up 8% while three of your top resellers quietly stall, because one partner had a huge month. Monitoring per partner, against that partner's own baseline, is how you identify areas that need attention before they drag down partner program success.
There's also a resource allocation angle. Your channel account managers have limited hours. Continuous monitoring tells them where to spend them this week: the partner whose goal pace fell off a cliff, the deal that's been registered and ignored, the dormant reseller who just logged back in and needs a call today, not next month. That's what data driven decisions look like in a partner program. Not more dashboards, but better aimed attention.
Not every anomaly is a problem
Good monitoring flags the unusual, not just the bad. A partner whose activity doubles might be onto a big opportunity, or might be a data error. A dormant partner registering a $500K deal is great news, and it's also a moment that needs your support right now. A single partner suddenly sourcing 40% of new pipeline is worth celebrating and worth watching, because concentration is a risk.
That's why the best approach pairs every flag with context and leaves the call to a human: celebrate, intervene or ignore.
The skill to use: Ecosystem Anomaly Detector
Ecosystem Anomaly Detector is a vendor side skill from Introw's free Claude skill library. It runs a continuous monitoring scan across your partner ecosystem through Introw's MCP server, reading live partner data from your CRM and partner portal, and returns a short, ranked list of what changed materially and who should look at it.
| Detail | Ecosystem Anomaly Detector |
|---|---|
| Built for | Partner program managers, channel RevOps and partner development managers |
| Use it when | You want to know what's unusual in your partner ecosystem this week, before it becomes a quarterly surprise |
| What it reads | Partners, engagement, deals and pipeline, registrations, goals and commissions |
| What it writes | Nothing by default. Comments on partner records to log decisions, only when you ask and approve |
| What you get | Top anomalies table, watch list, cohort findings, suppression log and a comparison to the last run |
| Skill ID | vendor-anomaly-detector |
It looks for ten classes of anomaly:
| Anomaly class | What triggers a flag |
|---|---|
| Activity drop | 30 day engagement more than 50% below the partner's 90 day baseline |
| Activity spike | Engagement suddenly more than twice the baseline |
| Dormant reactivation | Inactive for 60 days or more, then a new deal or login |
| Register and stall | A registered deal with no follow up activity for 14 days or more |
| Deal size outlier | A registration more than three times the partner's average deal |
| Stage velocity anomaly | Deals stuck in a stage more than twice the cohort median |
| Tier pace divergence | A partner pacing well above or below their tier's median run rate |
| Goal pace cliff | On track for a goal last week, off pace this week |
| Cohort level shift | A whole region, tier or partner type moving together, like DACH registrations halving |
| Concentration risk | An unusual share of new pipeline coming from a single partner |
It's the ecosystem wide companion to per partner risk scoring. Where a risk score tells you how healthy one partner looks, anomaly detection finds the patterns a per partner view misses, like a whole segment's engagement dropping at once.
Trigger phrases include "anomaly check", "what's unusual this week", "weird partner behavior", "spot the outliers", "ecosystem anomalies" and "what changed materially".
How the skill works, step by step
The skill follows six steps. You don't need to run them yourself, but knowing what's happening makes it easier to trust the output.

Step 1: Set the scope and sensitivity
By default, the skill scans your full active partner base and compares the last 7 days with a trailing 90 day baseline. You can narrow it to a tier, region, partner type or cohort.
You also choose the sensitivity. Aggressive flags anything more than one standard deviation from normal. Conservative, the default, only flags deviations beyond two. The skill defaults to conservative on purpose, because false positive fatigue is the fastest way to get a monitoring report ignored.
Step 2: Pull the baseline and current state
The skill reads both windows for every partner: the partner list with tier, region and lifecycle stage, engagement, deal stage, value and velocity, registration cadence, goal pacing against expected run rate, and commission events.
Step 3: Compare every partner with their own normal
For each partner and each signal, it works out the current value, the 90 day median, and how far apart they are. Every flag comes with the signal name, current value, baseline, percentage deviation and plausible explanations. You never get a bare "down 60%" with no context.
Step 4: Cluster and classify
Flags get grouped three ways:
- Per partner: a partner with several flags at once (engagement drop, goal pace cliff and a stalled registration) ranks higher than a partner with one.
- Per cohort: flags rolled up by tier, region and partner type, so you catch segment wide shifts.
- Per class: which kinds of anomaly are firing most this week.
Step 5: Filter out the noise
This is the step that makes the report readable. The skill suppresses anomalies with known explanations, like holidays, vendor side outages or normal seasonality. It suppresses small partners where one or two events swing the percentages wildly. And it doesn't resurface last week's flags unless they got worse. Everything it filters out goes into a suppression log, so you can see what it chose not to show you.
Step 6: Surface what needs action
You get the top 5 to 10 anomalies ranked by severity and revenue exposure, a watch list of 10 to 20 secondary flags, any cohort level findings, and a recommended action for each high priority item: who should look at it and which skill to run next.
Get the skill: the full SKILL.md
Here's the complete skill file. Copy it as is, or adjust the thresholds, windows and anomaly classes to fit your program.
---
name: vendor-anomaly-detector
description: Use when a Channel Chief, RevOps, or PDM wants a continuous-monitoring scan across the partner ecosystem to surface unusual behaviors, sudden activity drops or spikes, atypical deal patterns, dormant-partner reactivations, register-then-stall sequences, abnormal goal pacing, before they show up as quarterly surprises. Trigger phrases include "anomaly check", "what's unusual this week", "weird partner behavior", "spot the outliers", "ecosystem anomalies", "what changed materially".
---

# Ecosystem Anomaly Detector (Vendor)

**Audience**: Vendor, uses **claude.ai Introw** MCP.
**Use case**: 14, Ecosystem Performance.

## When to use this skill

Use when a Channel Chief, RevOps, or PDM wants a continuous-monitoring scan across the partner ecosystem to surface unusual behaviors, sudden activity drops or spikes, atypical deal patterns, dormant-partner reactivations, register-then-stall sequences, abnormal goal pacing, before they show up as quarterly surprises.

**Sample prompts that fire this skill:**
- "anomaly check"
- "what's unusual this week"
- "weird partner behavior"
- "spot the outliers"
- "ecosystem anomalies"
- "what changed materially"

## Why this matters
Ad-hoc analytics requests consume **30 to 50% of channel RevOps team capacity**. Most channel programs catch material changes weeks late, partner X went dark in week 2, nobody noticed until the QBR in week 12. Continuous anomaly detection makes the program **operationally responsive** instead of retrospective: when something unusual happens, somebody knows within days, not quarters.

The companion to `vendor-detect-at-risk-partners` (which scores per-partner risk): anomaly detection works **ecosystem-wide**, finding patterns the per-partner view misses (cohort-level shifts, segment-wide engagement drops, unusual deal-size spikes).

## Anomaly classes to detect

1. **Activity drop**: partner whose 30-day engagement is below their trailing 90-day baseline by > 50%.
2. **Activity spike**: partner whose engagement is suddenly > 2× their baseline (worth understanding, opportunity or noise).
3. **Dormant reactivation**: partner who was inactive 60+ days and just registered a deal or logged in.
4. **Register-and-stall**: partner who registered a deal but no follow-up activity in 14+ days.
5. **Deal-size outlier**: registration with deal value > 3× the partner's historical average (legitimate big deal or data error).
6. **Stage-velocity anomaly**: deals stuck in stage > 2× the cohort median for that stage.
7. **Tier-pace divergence**: partner pacing materially above or below their tier's median run-rate.
8. **Goal-pace cliff**: partner who was on track for a goal and suddenly fell off-pace this week.
9. **Cohort-level shifts**: a whole segment (region, tier, partner type) showing aggregate unusual movement (e.g., DACH SI registrations halved this week).
10. **Concentration risk**: an unusual fraction of new pipeline coming from a single partner, celebrate but flag.

## Process

### Step 1: Define the scope
- Default: full active partner base, trailing 7-day window vs. trailing 90-day baseline.
- Optional: scope to tier, region, partner type, or a specific cohort.
- Sensitivity setting: aggressive (flag > 1σ deviations) vs. conservative (> 2σ). Default conservative, false-positive fatigue is the enemy.

### Step 2: Pull baseline + current state
- `Introw:search_partners`: base set with tier, lifecycle stage, region.
- `Introw:search_partner_engagement`: engagement over current window AND baseline window.
- `Introw:search_crm_objects`: deal stage / value / velocity over both windows.
- `Introw:search_form_submissions`: registration cadence.
- `Introw:get_goals`: goal pacing vs. expected run-rate.
- `Introw:search_commissions`: commission events as a performance proxy.

### Step 3: Compute deviations per partner per signal
For each partner × signal:
- Compute current-window value.
- Compute trailing baseline (90-day median).
- Flag deviations beyond the configured sensitivity threshold.
- Annotate each flag with: signal name, current value, baseline, % deviation, plausible explanations.

### Step 4: Cluster and classify
- **Per-partner**: how many signals are flagged for the same partner? Multi-signal flags (engagement drop + goal-pace cliff + register-and-stall) score higher than single-signal flags.
- **Per-cohort**: aggregate flags by tier / region / partner type to spot ecosystem-level shifts.
- **Per-class**: which anomaly classes are firing most this week?

### Step 5: Filter for signal quality
- Suppress known-explainable: holidays, vendor-side outages, expected seasonality.
- Suppress noisy: very small partners where 1 to 2 events shift percentages dramatically.
- Suppress already-flagged: don't re-surface anomalies escalated last week unless they got worse.

### Step 6: Surface for action
- **High-priority anomalies**: top 5 to 10, ranked by severity × revenue exposure.
- **Watch list**: 10 to 20 secondary flags worth knowing.
- **Cohort-level findings**: anything ecosystem-wide.
- **Recommended action** per high-priority item: who should look at it, what skill to run next (`vendor-detect-at-risk-partners`, `vendor-coach-partner-deal`, `vendor-activate-network-with-personalized-campaigns`, etc.).

## Output format
- **Top anomalies** table: partner, anomaly class, severity, revenue exposure, recommended next action, owner.
- **Watch list** (less urgent).
- **Cohort findings** (ecosystem-wide patterns).
- **Suppression log**: what was filtered out and why (transparency for trust calibration).
- **Comparison to last run**: what's new vs. what's been on the list.

## Guardrails & PRM best practice
- **Anomaly ≠ problem.** Some anomalies are good news (a dormant partner just registered a $500K deal). The skill flags unusual; the human decides if it's celebrate, intervene, or ignore.
- **Conservative defaults.** False positives erode trust faster than false negatives. Better 5 high-quality flags than 50 noisy ones.
- **Always state the window.** Anomalies are window-relative; without explicit windows, comparisons are meaningless.
- **Suppress small-N noise.** A partner with 3 lifetime registrations doesn't have a stable baseline; flag thresholds need minimum-sample-size guards.
- **Pair with explanation.** Don't surface a flag without context. "Engagement dropped 60%" is not actionable; "Engagement dropped 60%, last activity was 12 days ago, prior cadence was every 3 days, no recent CRM updates either" is.
- **Don't auto-act.** Surface, don't act. Anomaly-driven auto-actions risk over-correcting on noise.
- **Run on cadence.** Daily for active programs, weekly for smaller. Anomalies discovered three weeks late aren't anomalies anymore, they're confirmed problems.
- **Feed the digest.** This skill's output is the natural input for `vendor-slack-weekly-channel-digest`'s "Anomalies" section.
- **Capture decisions.** When an anomaly is investigated and resolved (or dismissed), log via `Introw:add_comment` on the relevant partner so the next run has context for suppression.
- **Cross-skill handoff.** Per-partner anomalies → `vendor-detect-at-risk-partners` for full risk-scoring; segment-wide drops → `vendor-activate-network-with-personalized-campaigns` for cohort intervention; deal-velocity issues → `vendor-coach-partner-deal` or `vendor-deal-coach-from-similar-wins`.
How to install and run the skill
You've got two ways to use it, depending on where you work.
Option 1: Claude Code
Create a folder called vendor-anomaly-detector inside .claude/skills/ in your repo, and save the file above as SKILL.md inside it. Claude Code picks it up automatically and runs it whenever your prompt matches the trigger phrases in the description.
Option 2: Claude (or any MCP client) with the Introw connector
You don't need to be technical for this one. Connect Claude to Introw once, and you can run the same scan in plain language from Claude, or from ChatGPT, Slack, Teams or your CRM. Introw is listed in Claude's connector directory, so it's one click plus a sign in, with no server URL to paste. Here's how connecting looks:
The step by step version lives in the Connect Claude guide, and the Claude integration page covers what you can do once you're connected.
Prompts to try
Once the skill is installed or Claude is connected, try any of these:
- "Anomaly check." Runs the full scan across every active partner with conservative defaults.
- "What's unusual this week?" Gets you the top anomalies table and the watch list first.
- "Spot the outliers in our EMEA resellers, aggressive sensitivity." Scopes the scan to one segment and flags smaller deviations.
- "What changed materially since last week's run?" Focuses on new flags and anything that got worse.
- "Run an anomaly check on Gold partners and show me the suppression log." Lets you see what was filtered out and why.
If you run an active program, make the scan a habit: daily for busy programs, weekly for smaller ones.
What you'll get back
A typical run returns five things:
- Top anomalies table: partner, anomaly class, severity, revenue exposure, recommended next action and owner.
- Watch list: the less urgent flags worth knowing about.
- Cohort findings: anything moving across a whole tier, region or partner type.
- Suppression log: what was filtered out and why, so you can calibrate how much to trust the scan.
- Comparison to last run: what's new, what's resolved and what's still on the list.
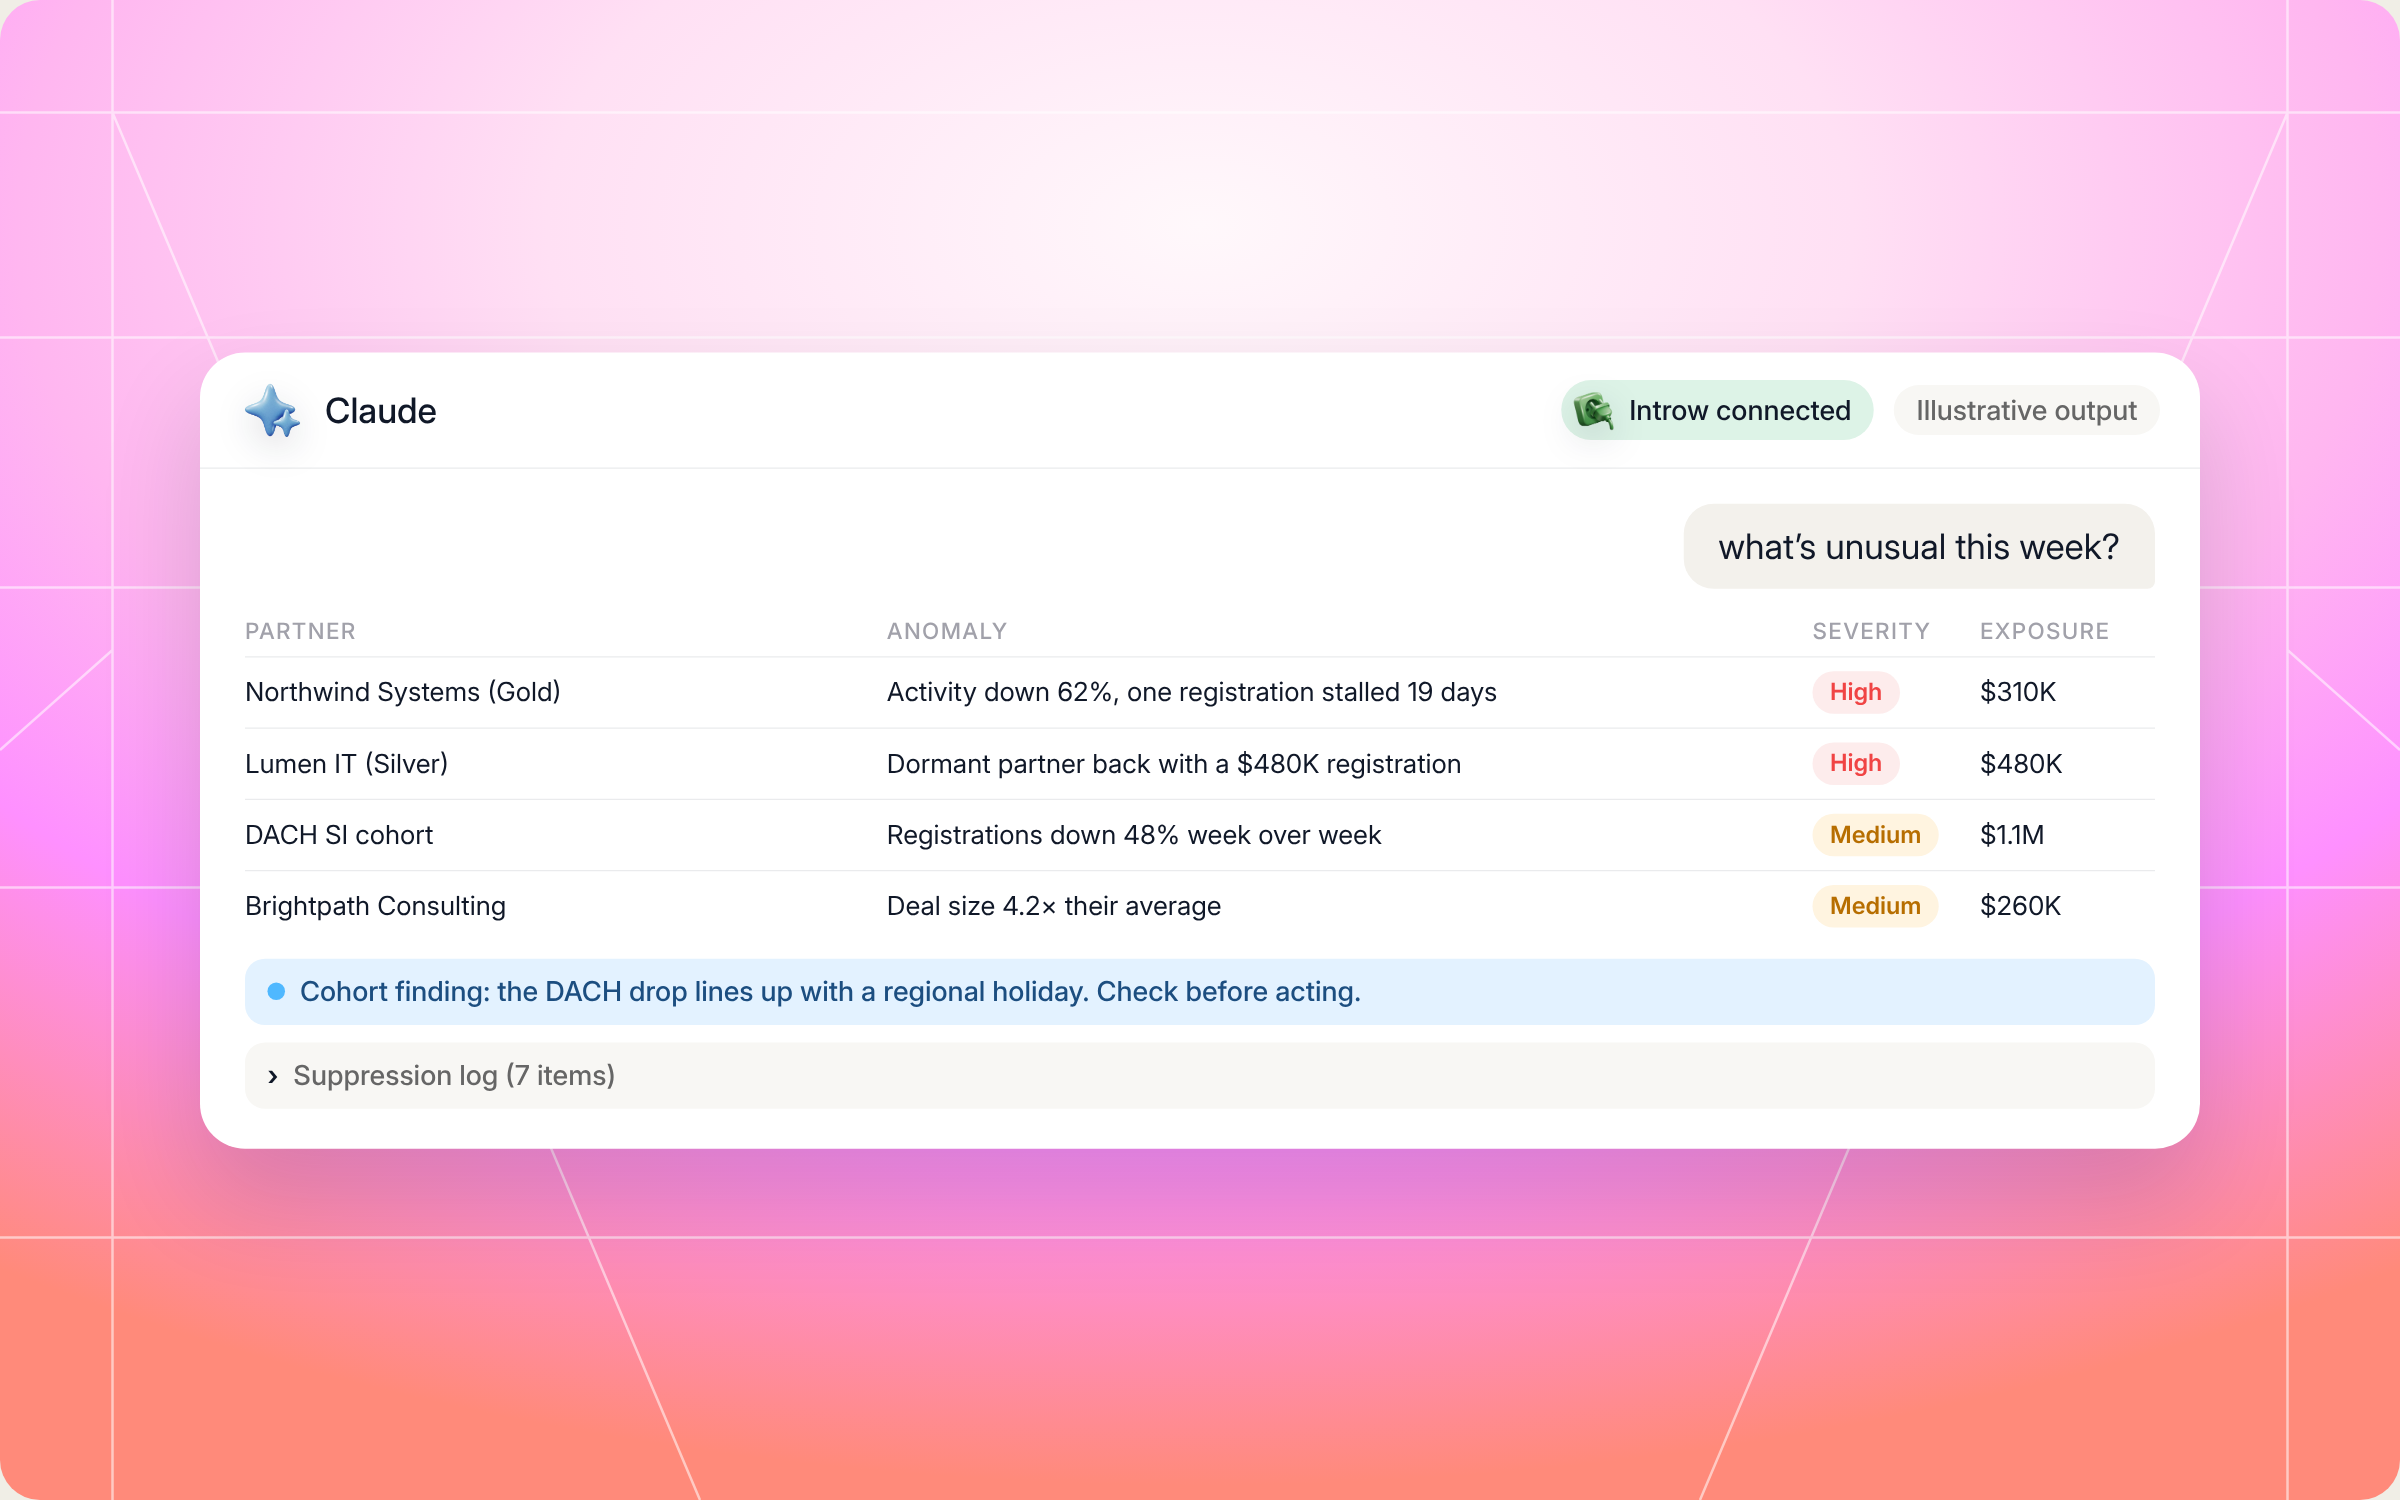
Here's an illustrative example of a top anomalies table (fictional partners):
| Partner | Anomaly | Severity | Revenue exposure | Recommended next action | Owner |
|---|---|---|---|---|---|
| Northwind Systems (Gold) | Activity drop of 62%, goal pace cliff, one registration stalled for 19 days | High | $310K open pipeline | Call the partner this week, then run a risk check | Partner manager, EMEA |
| Lumen IT (Silver) | Dormant reactivation, new $480K registration | High | $480K | Celebrate, assign a sales engineer, run deal coaching | Partner manager, NA |
| DACH SI cohort | Cohort level shift, registrations down 48% week over week | Medium | $1.1M pipeline at current pace | Check for a holiday or outage, then plan a cohort campaign | Channel lead, DACH |
| Brightpath Consulting (Silver) | Deal size outlier, 4.2 times their average | Medium | $260K | Confirm the deal value with the partner before it hits forecast | Channel RevOps |
And each flag carries its context. For Northwind, that reads something like: engagement down 62% against baseline, last activity 12 days ago, prior cadence every 3 days, no CRM updates on their open deals either. That's the difference between a number and actionable insights.
Staying in control: what Claude can and can't do
A monitoring scan only helps if people trust it. A few things are built in:
- It surfaces, it doesn't act. The skill flags what's unusual and recommends a next step. It doesn't email partners, change tiers or edit deals on its own, because acting automatically on anomalies risks overcorrecting on noise.
- You approve the writes. The only thing it writes is a comment on a partner record to log a decision, and only when you ask and approve it.
- It stays inside your access. Claude connects to Introw over OAuth as you, so it can only see and do what you can.
- It defaults to fewer, better flags. Five high quality flags beat fifty noisy ones. Conservative sensitivity and small sample guards keep partners with three lifetime registrations from triggering false alarms.
- It always states the window. Every flag says what period it compared against what baseline, so nobody argues about the numbers.
- It explains itself. Every flag comes with context, and the suppression log shows what it chose not to flag.
- Anomaly doesn't mean problem. Some flags are good news. You decide whether to celebrate, intervene or ignore.
Prefer to do this in the Introw app?
If you'd rather start from a dashboard, you can read any single partner's analytics in Introw: revenue, engagement, top deals and goal progress in one view. It's the quickest way to dig into a partner the scan just flagged, or to prep for a check in.
The read a partner's analytics guide walks through it step by step. For program wide views, Introw's partner reports and dashboards let you build the views your team checks every week, and our guide on how to build a partner dashboard covers what to put on it.
Pair it with other Claude skills
Anomaly detection tells you where to look. Other skills in the library help you act on what you find:
- Weekly Channel Slack Digest: posts a weekly summary of wins, at risk partners, approvals and KPI changes to your team's Slack. The anomaly scan is the natural input for its "Anomalies" section.
- Activate the Network with Personalized Campaigns: when a whole segment drops, this skill diagnoses why each partner stalled and drafts a campaign tied to their goals.
- Deal Coach from Similar Wins: when deals are stuck in stage, it coaches the partner's live deal using patterns from your past wins.
- QBR Preparation: pulls pipeline, goals, engagement and commissions into a QBR agenda, so the flags and decisions from your scans feed straight into the review.
You'll find all of them in Introw's skill library, and our roundup of Claude skills for partner teams explains how they fit together.
Monitor partner performance from Claude with Introw
Introw is a CRM first partner relationship management platform, which means it builds on top of your existing HubSpot or Salesforce setup rather than replacing it. It's also headless by design: the partner portal is one surface, but you can run the same program in plain language from Claude, ChatGPT, Slack or Teams through Introw's MCP server, with every action written back to your CRM.
That's what makes a skill like this work. Engagement, deal registration, pipeline, goals and commissions all live in one place, so the baseline is built on real partner performance data, not a spreadsheet someone exported last month. Introw's partner performance tools give you the dashboards, and the MCP server lets Claude watch them for you. When a flag needs action, partner engagement tools like announcements, tasks and journeys are right there to follow up, and you can tie the results back to partner program ROI.
Connect Claude to your partner program and run your first anomaly check today. Connect Claude or book a demo.
Still curious? Here are some quick answers to help clear things up
Partner performance monitoring is the ongoing practice of comparing each partner's current activity with their own baseline so you spot drops, spikes and stalled deals early. It's the early warning layer of partner performance management, and it works best on a daily or weekly cadence.
Start with signals that move before revenue does: partner engagement, deal registration cadence, stage velocity, goal pacing and revenue contribution. Commissions and training completion rates are useful supporting signals.
No. Claude Code users can drop the SKILL.md into their skills folder. Everyone else can connect Claude to Introw through the connector directory and run the same scan in plain language.
No. It surfaces anomalies and recommends next steps, and you decide what to do. The only thing it writes is a comment on a partner record to log a decision, and only after you approve it.
Yes. The full file is in this article and in Introw's skill library. You can copy it as is or adapt it to your program, but it reads live partner data through Introw's MCP server, so you'll need Introw connected to run it.






See AI-Native PRM in Action
Book a demo with one of our partner program experts, or explore Introw on your own time.